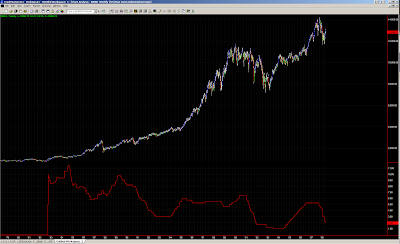
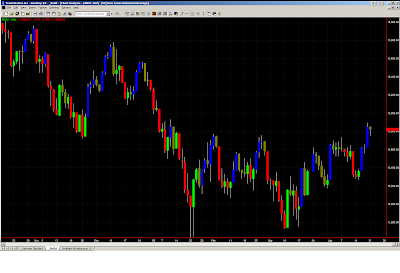
I recently saw a comment indicating that each bull/bear market has its signature patterns. For example the bear market of 2000-2002 had V bottoms as bottoming patterns. It appears that the first pattern is created based on events/emotions and then the various players try to game that initial pattern to base their subsequent trades. So we get a similar pattern that morphs a little but retains the basic structure. Here are a few examples:
Friday, September 12, 2008
Sunday, June 22, 2008
Monday, June 16, 2008
Wedges
Thursday, June 5, 2008
Monday, May 19, 2008
Sunday, May 18, 2008
Saturday, May 17, 2008
Where to find the tradestation code?
I got a question on how to get to the code for the tradestation indicators. To copy the code, click on a blog post's heading [for e.g. 'Fed Funds Target rate'] and the code for the indicator is the first comment. The code then needs to be copied to a new indicator/paintbar on your tradestation platform. Once that is created you can then apply that indicator/paintbar to any of your charts. This whole process requires some good knowlege of the platform [in my view a force multiplier on TS].
Most of the indicators have the code attached. Some that don't are because they are a bit involved but if you are interested please leave me a comment and I will be more than happy to share any of the indicators.
Thursday, May 8, 2008
Fed Funds Target rate
St Louis Fed has lots of free data available for download.
http://research.stlouisfed.org/fred2/
Fed Funds rate data since 1983 can be found there. Here is the chart of the rate as a TS indicator.
http://research.stlouisfed.org/fred2/
Fed Funds rate data since 1983 can be found there. Here is the chart of the rate as a TS indicator.
Monday, April 21, 2008
Break out / Break down
Breadth and Volume studies
Subscribe to:
Posts (Atom)